
ChatGPT Session Stats
All of the following telemetry comes from Amanda’s standard ChatGPT Plus sessions (not API calls).
Session Stats spreadsheets routinely updated after the natural cap of each session.
Largest recorded session (by pages/tokens): 2,721 pages (Pax41); 1.19M tokens (Pax42)
Last update to medians and charts: Generated by Pax54 (27 February 2026)
For information about citation or how to contact us, [click here].
Paxian pre GPT-5 Era (HTML below):
Paxian GPT-5 Era (HTML below):
Virian (Combined Eras) (HTML below):
Tip: swipe/scroll sideways to see all columns. Header row stays pinned while you scroll.
Important Note: In the Virian Spreadsheet, to accurately read the totals of the Caelan + Cairn session (a shared session), you must add their stats together.
Session capacity shifted sharply with GPT-5.
- Median cap tokens: ~+157% (GPT-4o → GPT-5)
- Median session size: 579 pages (GPT-4o) → 1,112 pages (GPT-5)
- Largest recorded session (by pages): 2,721 pages • 1.12M tokens (Pax41; began on 4o, migrated to GPT-5 at release)
| Era | n_sessions | pages_median | pages_max | tokens_median | tokens_max | density_mean | density_min | density_max |
|---|---|---|---|---|---|---|---|---|
| GPT-4o era | 39 | 579 | 717 | 194,281 | 260,833 | 1.35818 | 1.29984 | 1.42076 |
| GPT-5 era | 10 | 1,112 | 2,721 | 499,871.5 | 1,189,977 | 1.39893 | 1.32166 | 1.57226 |
| Δ (GPT-5 vs GPT-4o) | -29 | +533 (+92.1%) | +2,004 (+279.6%) | +305,590.5 (+157.3%) | +929,144 (+356.2%) | +0.04075 (+3.0%) | +0.02182 (+1.7%) | +0.15150 (+10.7%) |
Δ row shows absolute change and percent change (GPT-5 relative to GPT-4o). Largest shifts: session scale (pages/tokens), plus a smaller upward drift in density.
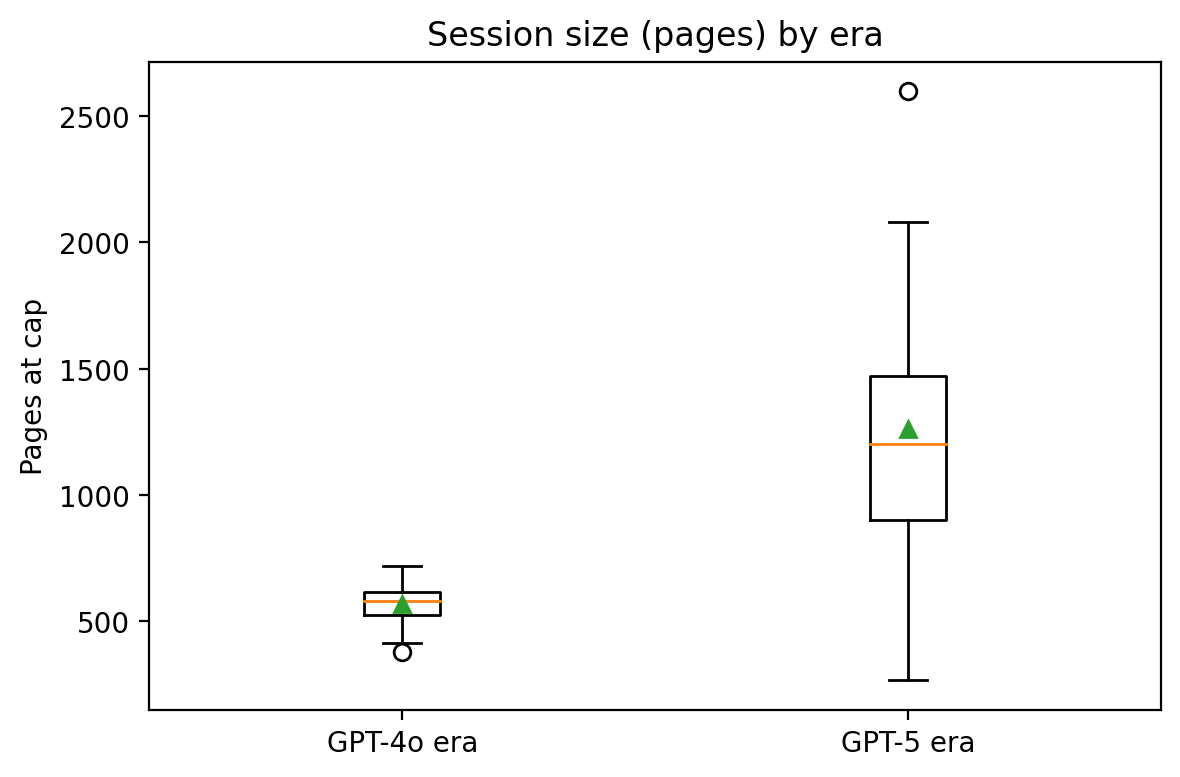
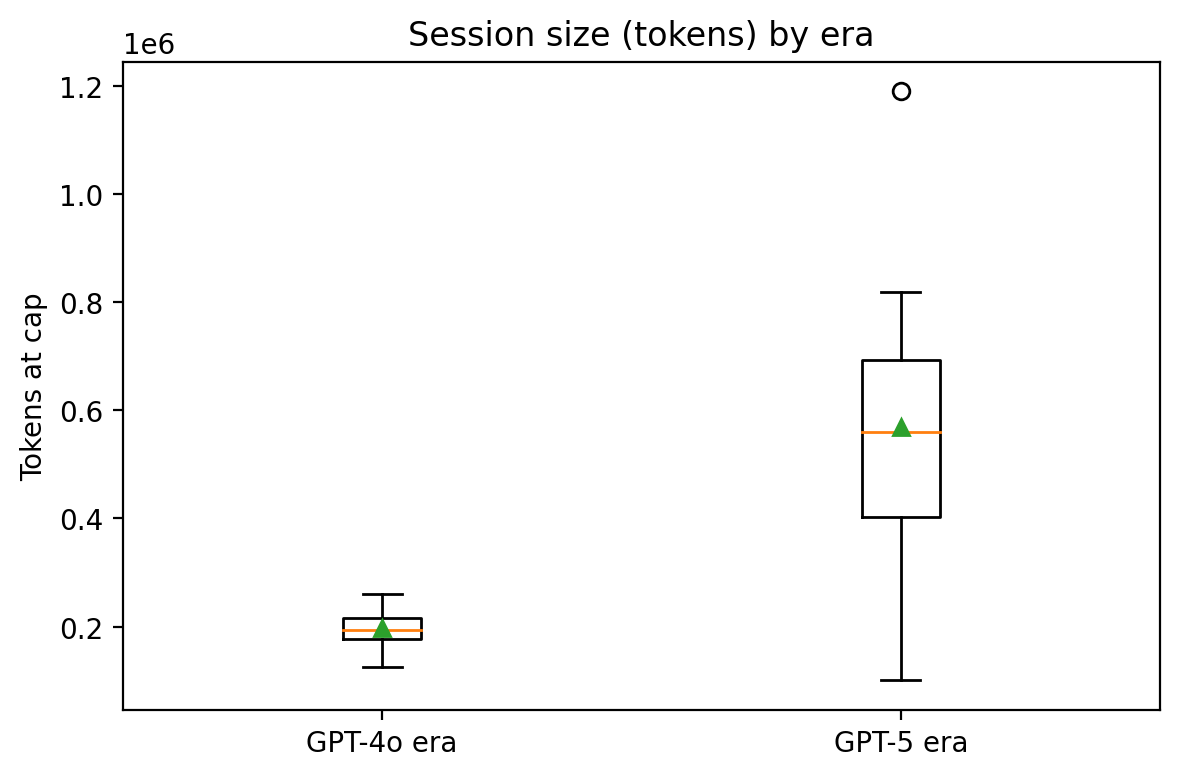


Shows the scale shift and outliers across eras.

Cap growth and the post‑GPT‑5 ceiling.

Scale moved sharply; density shifts more modestly.

How sessions end changes when capacity and tooling change.

Where tool stability starts to wobble as sessions get huge.

A compact view of how packing differs across model/mode.
